Fortune India 500 2025 edition
Rank#119- Total income
- ₹23,219 Cr
- Profit
- ₹2,717 Cr
Last year #121
Siemens is a publicly listed company based in United States founded in 1847. Industrial software is developed for automation, electrification, and digitalization solutions. The company has 11,710 employees. Siemens has completed 107 acquisitions, including AEC - American Electronic Components, AIT and AXIT GMBH. Its chief executive, as recorded, is Roland Busch. Its website siemens.com draws about 7.9 million monthly visits. Its Indian entity Siemens Limited reported revenue of ₹26,069 Cr. Siemens offers products and services including Xcelerator Marketplace, Generative AI Solutions, and Products and Services. Its competitors include Cogniac, Cumulus Digital Systems and Headwall Photonics; 2 of its 3 listed competitors have raised funding.
Siemens was founded in 1847 and is headquartered in the United States. Industrial software is developed by the company, focusing on automation, electrification, and digitalization within the technology sector. A marketplace for digital offerings and associated services is operated. Resources covering corporate details, privacy policies, and terms of use are maintained. Dedicated channels for press releases, investor relations, and career opportunities are provided to stakeholders.
Siemens is ranked #119 on the Fortune India 500 (2025) and #16 on the Fortune MNC 500 India (2026).
SIEMENS · NSE
-0.38% today
FY 2025-26
Margin 11.2%
FY 2025-26
P/B 9.2x
ROCE 13.5%
Interest cover 3.1x
Nov 2023
& 4 more
& 106 more
Siemens operates through Siemens Limited, a listed company (active). Its filings, financials, charges and directors are on the company page.
| Legal entity | Status | Incorporated | Registered in | Revenue (FY 2026) | Employees | Directors | Company page |
|---|---|---|---|---|---|---|---|
| Siemens Limited Listed CIN L28920MH1957PLC010839 | Active | 02 Mar 1957 | Mumbai, Maharashtra | ₹26,069 Cr | 7,989 | 11 | View details |
Siemens offers a comprehensive portfolio of products and services, including Xcelerator Marketplace, Generative AI Solutions, and Products and Services.
Platform for accessing Siemens ecosystem and services globally.
Tools for industrial AI developments and trend reports.
Range of solutions for various industries and applications.
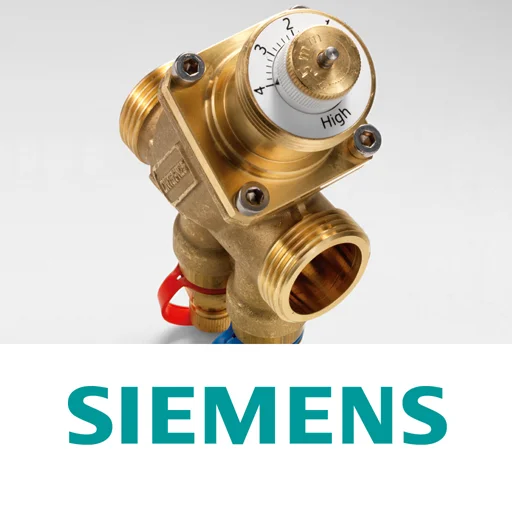
Siemens publishes 1 mobile app with over 10K+ downloads.
(Mar 2004)
Latest 10 of 172 funding rounds of Siemens with amounts and investors; the two latest post-money valuations are shown, the rest are part of the premium plan.
| Date | Amount | Transaction Name | Valuation | Lead Investors | Investors |
|---|---|---|---|---|---|
| Nov 2023 | $33,736 | Grant | – | – | |
| Oct 2023 | $43,901 | Grant | – | – | |
| Oct 2023 | $28,458 | Grant | – | – | |
| Oct 2023 | $103,219 | Grant | – | – | |
| Oct 2023 | $191,557 | Grant | – | – | |
| Oct 2023 | $23,422 | Grant | – | – | |
| Sep 2023 | $601,362 | Grant | – | – | |
| Jul 2023 | $33,905 | Grant | – | – | |
| Jan 2022 | $99,328 | Grant | – | – | |
| Jan 2022 | $193,403 | Grant | – | – |
5 investors in total: 5 institutional.
Siemens has secured backing from 5 investors, including institutional investors. Prominent investors backing the company include European Union, BMBF and Federalministryforeconomicaffairsandenergy.
| Investor | Description | Founded Year | Domain | Location |
|---|---|---|---|---|
Government entites focused on freedom, democracy, equality and the rule of law, promoting peace and stability | 1958 | europa.eu | Brussels, Belgium | |
Education and research policies are overseen by the ministry. | 1955 | bmbf.de | Berlin, Germany | |
Scientific and technical information is managed and disseminated by OSTI.GOV. | osti.gov | Oak Ridge, United States | ||
Administers health care and support for military personnel and operations. | health.mil | Falls Church, United States |
The complete investor list, round-by-round participation and investor portfolios require an active premium plan.
Verified entity values are shown only after access is granted.
Siemens Limited is the primary company behind Siemens. The board of Siemens Limited currently have 9 directors; the longest-serving is Deepak Shantilal Parekh, appointed in 2003. 31 earlier directors have ceased.
| Director | Designation | Appointed | Tenure | Entity |
|---|---|---|---|---|
| Deepak Shantilal Parekh DIN 00009078 | Director | 07 Nov 2003 | 23 yrs | Siemens Limited |
| Sunil Dass Mathur DIN 02261944 | Managing Director | 22 Jul 2008 | 18 yrs 3 mo | Siemens Limited |
| Tim Oliver Holt DIN 08742663 | Director | 01 Jun 2020 | 6 yrs 5 mo | Siemens Limited |
| Matthias Ernst Rebellius DIN 08975071 | Nominee Director | 12 Feb 2021 | 5 yrs 8 mo | Siemens Limited |
| Sindhu Gangadharan DIN 08572868 | Director | 12 May 2022 | 4 yrs 5 mo | Siemens Limited |
| Shyamak Ramyar Tata DIN 07297729 | Director | 30 Jan 2023 | 3 yrs 9 mo | Siemens Limited |
| Anami Narayan Prema Roy DIN 01361110 | Director | 01 May 2023 | 3 yrs 6 mo | Siemens Limited |
| Juergen Michael Wagner DIN 10101116 | Director | 01 May 2023 | 3 yrs 6 mo | Siemens Limited |
| Wolfgang Wrumnig DIN 10409511 | Whole-time director | 14 Feb 2024 | 2 yrs 8 mo | Siemens Limited |
1352 people are tracked at Siemens (482 in leadership, 870 in team); the tracked headcount is 11,710.
| Name | Role | Group |
|---|---|---|
Roland Busch | CEO & President | Leadership |
| CEO & MD | Leadership | |
Laura Engelhardt | Head Of Strategy And Transformation | Leadership |
Beatrice Bock | Chief Financial Officer, Mobility | Leadership |
Vasi Philomin | Executive Vice President, Data And AI | Leadership |
Scot Gardner | Executive Vice President, Sales And Marketing - Siemens Digital Industries | Leadership |
Kal Mos | Executive Vp, Research & Predevelopment At Siemens | Leadership |
Emilio Tuinenburg | Head Of Service And Technology | Leadership |
Jesse Romano | Director S&c Systems | Leadership |
Simon Rennie | Head Of Digital (rolling Stock) | Leadership |
Stefanie Huth | Global Head Of Executive Search | Leadership |
Mitesh Sheth | Account Director | Leadership |
Paul Limpitlaw | Head Of Business Development, Process Automation, Oil & Gas And Minerals | Leadership |
Fernando Pozuelo Vivas | Head Of IT APS LCW Enablement & Consulting And Service Owner For ACES (based On Pega) | Leadership |
Wilbert W. West | Director Of Industrial Vertical, EP Project Management Organization | Leadership |
Dalee Byrd | People & Organization (hr) Associate Business Partner | Leadership |
Cosima Schulz von Siemens | (senior) Human Resources Business Partner | Leadership |
Eric R. Lotz | National Federal Business Development-director | Leadership |
Jessin O. | Global Financial Controller Of IT Sustainability & Business Partner | Leadership |
Wahid Issa | Head Of Partner Operations | Leadership |
1332 more people are available in the full profile.
Full employee and board profiles, team structure, tenure and professional contact details require an active premium plan.
Verified entity values are shown only after access is granted.
Siemens is a publicly listed company on the NSE with ticker symbol SIEMENS in India, operating in the Producer manufacturing sector. As a publicly traded entity, the company provides investors with opportunities to participate in its growth story through equity ownership. The listing enables access to capital markets, enhances corporate visibility, and provides liquidity for shareholders while maintaining transparency through regulatory compliance and regular financial disclosures.
Exchange-reported figures of Siemens Limited, the listed company behind Siemens (NSE: SIEMENS).
| Metrics | FY 2025-26 | Sep 2024 | Sep 2023 | Sep 2022 | Sep 2021 | Sep 2020 | Sep 2019 |
|---|---|---|---|---|---|---|---|
| Income statement | |||||||
| Revenue | 24,846 | 15,146 | 19,554 | 16,138 | 13,198 | 9,946 | 13,084 |
| Revenue growth | - | -22.5% | +21.2% | +22.3% | +32.7% | -24.0% | - |
| EBITDA | 2,789 | 2,059 | 2,487 | 1,860 | 1,452 | 1,003 | 1,490 |
| EBITDA margin | +11.2% | +13.6% | +12.7% | +11.5% | +11.0% | +10.1% | +11.4% |
| Profit before tax | 3,525 | 3,375 | 2,640 | 1,993 | 1,452 | 1,036 | 1,678 |
| Net profit | 2,805 | 2,373 | 1,941 | 1,525 | 1,087 | 768 | 1,066 |
| Net profit margin | +11.3% | +15.7% | +9.9% | +9.5% | +8.2% | +7.7% | +8.2% |
| EPS (₹) | 51.53 | 76.31 | 55.08 | 43.34 | 30.58 | 21.59 | 30.88 |
| Balance sheet | |||||||
| Total assets | 15,170 | - | - | - | - | - | - |
| Net worth | 13,840 | - | - | - | - | - | - |
| Total debt | 307 | - | - | - | - | - | - |
| Cash & bank | 5,612 | - | - | - | - | - | - |
| Net working capital | 10,536 | - | - | - | - | - | - |
| Cash flow | |||||||
| Cash from operations | (535) | - | - | - | - | - | - |
| Cash from investing | 3,695 | - | - | - | - | - | - |
| Cash from financing | (3,302) | - | - | - | - | - | - |
| Particulars | Sep 2026 | Jun 2026 | Mar 2026 | Dec 2025 | Sep 2025 | Jun 2025 | Mar 2025 | Dec 2024 |
|---|---|---|---|---|---|---|---|---|
| Revenue | 5,734 | 4,714 | 4,618 | 3,831 | 4,900 | 4,108 | 4,029 | 3,360 |
| Revenue growth (YoY) | +17.0% | +14.8% | +14.6% | +14.0% | +10.0% | +9.2% | - | - |
| Other income | 152 | 1,917 | 116 | 93.30 | 126 | 125 | 341 | 423 |
| EBITDA | 626 | 431 | 444 | 348 | 609 | 517 | 445 | 387 |
| EBITDA margin | +10.9% | +9.1% | +9.6% | +9.1% | +12.4% | +12.6% | +11.0% | +11.5% |
| Depreciation | 89.40 | 78.00 | 73.80 | 71.40 | 68.80 | 68.60 | 66.00 | 66.40 |
| Interest | 12.60 | 7.10 | 14.10 | 5.60 | 4.20 | 4.70 | 2.10 | 3.10 |
| Profit before tax | 676 | 2,262 | 472 | 364 | 662 | 569 | 718 | 740 |
| Tax | 171 | 119 | 101 | 86.10 | 176 | 146 | 135 | 126 |
| Net profit | 504 | 2,143 | 370 | 278 | 485 | 423 | 582 | 615 |
| EPS (₹) | 14.16 | 60.18 | 10.40 | 7.80 | 13.63 | 11.92 | 16.35 | 17.26 |
| Metrics | FY 2025-26 | Sep 2024 | Sep 2023 | Sep 2022 | Sep 2021 | Sep 2020 | Sep 2019 |
|---|---|---|---|---|---|---|---|
| Income statement | |||||||
| Revenue | 22,025 | 13,403 | 17,965 | 14,832 | 12,522 | 9,869 | 13,000 |
| Revenue growth | - | -25.4% | +21.1% | +18.4% | +26.9% | -24.1% | - |
| EBITDA | 2,205 | 1,719 | 2,277 | 1,635 | 1,457 | 1,020 | 1,503 |
| EBITDA margin | +10.0% | +12.8% | +12.7% | +11.0% | +11.6% | +10.3% | +11.6% |
| Profit before tax | 3,210 | 3,254 | 2,545 | 1,961 | 1,464 | 1,020 | 1,660 |
| Net profit | 2,591 | 2,326 | 1,891 | 1,513 | 1,101 | 756 | 1,054 |
| Net profit margin | +11.8% | +17.4% | +10.5% | +10.2% | +8.8% | +7.7% | +8.1% |
| EPS (₹) | 47.68 | 74.86 | 53.69 | 43.00 | 30.98 | 21.25 | 30.53 |
| Balance sheet | |||||||
| Total assets | 14,662 | - | - | - | - | - | - |
| Net worth | 13,526 | - | - | - | - | - | - |
| Total debt | 248 | - | - | - | - | - | - |
| Cash & bank | 4,826 | - | - | - | - | - | - |
| Net working capital | 9,696 | - | - | - | - | - | - |
| Cash flow | |||||||
| Cash from operations | (971) | - | - | - | - | - | - |
| Cash from investing | 4,052 | - | - | - | - | - | - |
| Cash from financing | (3,274) | - | - | - | - | - | - |
| Particulars | Sep 2026 | Jun 2026 | Mar 2026 | Dec 2025 | Sep 2025 | Jun 2025 | Mar 2025 | Dec 2024 |
|---|---|---|---|---|---|---|---|---|
| Revenue | 5,114 | 4,195 | 4,109 | 3,398 | 4,363 | 3,629 | 3,579 | 2,948 |
| Revenue growth (YoY) | +17.2% | +15.6% | +14.8% | +15.3% | +9.8% | +9.1% | - | - |
| Other income | 346 | 1,904 | 106 | 107 | 104 | 115 | 470 | 415 |
| Total expenses | 4,610 | 3,812 | 3,752 | 3,186 | 3,850 | 3,204 | 3,215 | 2,649 |
| EBITDA | 504 | 383 | 357 | 212 | 513 | 424 | 364 | 299 |
| EBITDA margin | +9.9% | +9.1% | +8.7% | +6.2% | +11.8% | +11.7% | +10.2% | +10.1% |
| Depreciation | 58.80 | 47.70 | 45.20 | 42.90 | 41.20 | 40.20 | 39.80 | 40.40 |
| Interest | 10.60 | 5.50 | 11.10 | 5.20 | 3.10 | 2.20 | 1.60 | 2.60 |
| Profit before tax | 781 | 2,234 | 406 | 272 | 573 | 497 | 792 | 671 |
| Tax | 146 | 112 | 94.80 | 62.60 | 153 | 128 | 117 | 108 |
| Particulars | Sep 2026 | Jun 2026 | Mar 2026 | Dec 2025 | Sep 2025 | Jun 2025 | Mar 2025 | Dec 2024 |
|---|---|---|---|---|---|---|---|---|
| Revenue | 5,734 | 4,714 | 4,618 | 3,831 | 4,900 | 4,108 | 4,029 | 3,360 |
| Revenue growth (YoY) | +17.0% | +14.8% | +14.6% | +14.0% | +10.0% | +9.2% | - | - |
| Other income | 152 | 1,917 | 116 | 93.30 | 126 | 125 | 341 | 423 |
| EBITDA | 626 | 431 | 444 | 348 | 609 | 517 | 445 | 387 |
| EBITDA margin | +10.9% | +9.1% | +9.6% | +9.1% | +12.4% | +12.6% | +11.0% | +11.5% |
| Depreciation | 89.40 | 78.00 | 73.80 | 71.40 | 68.80 | 68.60 | 66.00 | 66.40 |
| Interest | 12.60 | 7.10 | 14.10 | 5.60 | 4.20 | 4.70 | 2.10 | 3.10 |
| Profit before tax | 676 | 2,262 | 472 | 364 | 662 | 569 | 718 | 740 |
| Tax | 171 | 119 | 101 | 86.10 | 176 | 146 | 135 | 126 |
| Net profit | 504 | 2,143 | 370 | 278 | 485 | 423 | 582 | 615 |
| EPS (₹) | 14.16 | 60.18 | 10.40 | 7.80 | 13.63 | 11.92 | 16.35 | 17.26 |
| Particulars | FY 2025-26 | Sep 2024 | Sep 2023 | Sep 2022 | Sep 2021 | Sep 2020 | Sep 2019 |
|---|---|---|---|---|---|---|---|
| Revenue | 24,846 | 15,146 | 19,554 | 16,138 | 13,198 | 9,946 | 13,084 |
| Revenue growth | - | -22.5% | +21.2% | +22.3% | +32.7% | -24.0% | - |
| Other income | 1,224 | 1,633 | 496 | 487 | 321 | 315 | 398 |
| Total expenses | 22,057 | 13,087 | 17,067 | 14,278 | 11,746 | 8,944 | 11,594 |
| Employee cost | 2,545 | 1,398 | 2,014 | 1,806 | 1,639 | 1,546 | 1,555 |
| EBITDA | 2,789 | 2,059 | 2,487 | 1,860 | 1,452 | 1,003 | 1,490 |
| EBITDA margin | +11.2% | +13.6% | +12.7% | +11.5% | +11.0% | +10.1% | +11.4% |
| Depreciation | 415 | 246 | 321 | 317 | 297 | 252 | 199 |
| Interest | 72.70 | 69.60 | 22.80 | 36.30 | 24.30 | 29.50 | 11.50 |
| Profit before tax | 3,525 | 3,375 | 2,640 | 1,993 | 1,452 | 1,036 | 1,678 |
| Tax | 771 | 657 | 678 | 450 | 363 | 267 | 578 |
| Net profit | 2,805 | 2,373 | 1,941 | 1,525 | 1,087 | 768 | 1,066 |
| Net profit margin | +11.3% | +15.7% | +9.9% | +9.5% | +8.2% | +7.7% | +8.2% |
| EPS (₹) | 51.53 | 76.31 | 55.08 | 43.34 | 30.58 | 21.59 | 30.88 |
| Particulars | FY 2025-26 | Sep 2024 | Sep 2023 | Sep 2022 | Sep 2021 | Sep 2020 | Sep 2019 |
|---|---|---|---|---|---|---|---|
| Equity & liabilities | |||||||
| Share capital | 71.20 | - | - | - | - | - | - |
| Reserves & surplus | 13,769 | - | - | - | - | - | - |
| Shareholders' funds (net worth) | 13,840 | - | - | - | - | - | - |
| Minority interest | 11.20 | - | - | - | - | - | - |
| Secured loans | 0.00 | - | - | - | - | - | - |
| Unsecured loans | 307 | - | - | - | - | - | - |
| Total debt | 307 | - | - | - | - | - | - |
| Total liabilities | 15,170 | - | - | - | - | - | - |
| Assets | |||||||
| Gross block | 4,245 | - | - | - | - | - | - |
| Net block | 2,785 | - | - | - | - | - | - |
| Capital work in progress | 250 | - | - | - | - | - | - |
| Investments | 1.40 | - | - | - | - | - | - |
| Inventories | 2,589 | - | - | - | - | - | - |
| Sundry debtors | 3,902 | - | - | - | - | - | - |
| Cash & bank balances | 5,612 | - | - | - | - | - | - |
| Loans & advances | 4,476 | - | - | - | - | - | - |
| Total current assets | 16,579 | - | - | - | - | - | - |
| Total current liabilities | 6,043 | - | - | - | - | - | - |
| Net working capital | 10,536 | - | - | - | - | - | - |
| Total assets | 15,170 | - | - | - | - | - | - |
| Particulars | FY 2025-26 | Sep 2024 | Sep 2023 | Sep 2022 | Sep 2021 | Sep 2020 | Sep 2019 |
|---|---|---|---|---|---|---|---|
| Opening cash | 1,836 | - | - | - | - | - | - |
| Net cash from operating activities | (535) | - | - | - | - | - | - |
| Net cash from investing activities | 3,695 | - | - | - | - | - | - |
| Net cash from financing activities | (3,302) | - | - | - | - | - | - |
| Net change in cash | (142) | - | - | - | - | - | - |
| Closing cash | 5,612 | - | - | - | - | - | - |
| Particulars | FY 2025-26 | Sep 2024 | Sep 2023 | Sep 2022 | Sep 2021 | Sep 2020 | Sep 2019 |
|---|---|---|---|---|---|---|---|
| Growth | |||||||
| Sales growth | - | -22.5% | +21.2% | +22.3% | +32.7% | -24.0% | - |
| EBITDA growth | - | -17.2% | +33.7% | +28.0% | +44.9% | -32.7% | - |
| PBT growth | -30.4% | +27.9% | +32.5% | +37.3% | +40.1% | -38.3% | +19.7% |
| Net income growth | - | +22.3% | +27.3% | +40.3% | +41.4% | -27.9% | - |
| Revenue CAGR (3Y) | +13.1% | +4.7% | +25.3% | +7.2% | +1.0% | -3.5% | +6.5% |
| EBITDA CAGR (3Y) | +12.3% | +12.3% | +35.4% | +7.7% | +3.1% | -1.7% | +14.8% |
| Profitability & leverage | |||||||
| Net income margin | +11.1% | +18.0% | +10.0% | +9.6% | +8.3% | +7.7% | +8.4% |
| Return on capital employed | +13.5% | +15.7% | +20.2% | +14.8% | +13.9% | +11.0% | +18.8% |
| Return on net worth | +12.8% | +16.7% | +15.9% | +13.9% | +11.0% | +8.3% | +12.7% |
| Debt / equity | 0.02 | 0.02 | 0.01 | 0.01 | 0.00 | 0.00 | 0.00 |
| Long-term debt / equity | 0.01 | 0.01 | 0.01 | 0.00 | 0.00 | 0.00 | 0.00 |
| Interest cover | 3.06 | 3.84 | 1.05 | 2.35 | 2.10 | 3.93 | 0.89 |
| Efficiency & per share | |||||||
| Fixed asset turnover | 3.68 | 3.29 | 4.42 | 3.69 | 4.10 | 4.87 | 6.55 |
| Inventory turnover | 6.35 | 5.90 | 8.37 | 8.17 | 9.10 | 8.90 | 11.53 |
| Debtors turnover | 3.99 | 3.69 | 5.16 | 4.32 | 3.87 | 2.86 | 3.50 |
| EPS (₹) | 51.53 | 76.31 | 55.08 | 43.34 | 30.58 | 21.59 | 30.88 |
| Dividend per share (₹) | 18.00 | 12.00 | 10.00 | 10.00 | 8.00 | 7.00 | 7.00 |
| Book value per share (₹) | 388.77 | 431.37 | 367.62 | 326.13 | 290.66 | 266.63 | 254.20 |
| Particulars | Sep 2026 | Jun 2026 | Mar 2026 | Dec 2025 | Sep 2025 | Jun 2025 | Mar 2025 | Dec 2024 |
|---|---|---|---|---|---|---|---|---|
| Revenue | 5,114 | 4,195 | 4,109 | 3,398 | 4,363 | 3,629 | 3,579 | 2,948 |
| Revenue growth (YoY) | +17.2% | +15.6% | +14.8% | +15.3% | +9.8% | +9.1% | - | - |
| Other income | 346 | 1,904 | 106 | 107 | 104 | 115 | 470 | 415 |
| Total expenses | 4,610 | 3,812 | 3,752 | 3,186 | 3,850 | 3,204 | 3,215 | 2,649 |
| EBITDA | 504 | 383 | 357 | 212 | 513 | 424 | 364 | 299 |
| EBITDA margin | +9.9% | +9.1% | +8.7% | +6.2% | +11.8% | +11.7% | +10.2% | +10.1% |
| Depreciation | 58.80 | 47.70 | 45.20 | 42.90 | 41.20 | 40.20 | 39.80 | 40.40 |
| Interest | 10.60 | 5.50 | 11.10 | 5.20 | 3.10 | 2.20 | 1.60 | 2.60 |
| Profit before tax | 781 | 2,234 | 406 | 272 | 573 | 497 | 792 | 671 |
| Tax | 146 | 112 | 94.80 | 62.60 | 153 | 128 | 117 | 108 |
| Particulars | FY 2025-26 | Sep 2024 | Sep 2023 | Sep 2022 | Sep 2021 | Sep 2020 | Sep 2019 |
|---|---|---|---|---|---|---|---|
| Revenue | 22,025 | 13,403 | 17,965 | 14,832 | 12,522 | 9,869 | 13,000 |
| Revenue growth | - | -25.4% | +21.1% | +18.4% | +26.9% | -24.1% | - |
| Other income | 1,316 | 1,747 | 549 | 597 | 278 | 310 | 394 |
| Total expenses | 19,820 | 11,684 | 15,688 | 13,197 | 11,065 | 8,850 | 11,498 |
| Employee cost | 2,243 | 1,234 | 1,854 | 1,658 | 1,552 | 1,540 | 1,548 |
| EBITDA | 2,205 | 1,719 | 2,277 | 1,635 | 1,457 | 1,020 | 1,503 |
| EBITDA margin | +10.0% | +12.8% | +12.7% | +11.0% | +11.6% | +10.3% | +11.6% |
| Depreciation | 250 | 147 | 224 | 210 | 225 | 250 | 198 |
| Interest | 61.80 | 64.80 | 57.50 | 61.20 | 45.70 | 59.70 | 38.60 |
| Profit before tax | 3,210 | 3,254 | 2,545 | 1,961 | 1,464 | 1,020 | 1,660 |
| Tax | 664 | 589 | 634 | 430 | 362 | 263 | 573 |
| Net profit | 2,591 | 2,326 | 1,891 | 1,513 | 1,101 | 756 | 1,054 |
| Net profit margin | +11.8% | +17.4% | +10.5% | +10.2% | +8.8% | +7.7% | +8.1% |
| EPS (₹) | 47.68 | 74.86 | 53.69 | 43.00 | 30.98 | 21.25 | 30.53 |
| Particulars | FY 2025-26 | Sep 2024 | Sep 2023 | Sep 2022 | Sep 2021 | Sep 2020 | Sep 2019 |
|---|---|---|---|---|---|---|---|
| Equity & liabilities | |||||||
| Share capital | 71.20 | - | - | - | - | - | - |
| Reserves & surplus | 13,454 | - | - | - | - | - | - |
| Shareholders' funds (net worth) | 13,526 | - | - | - | - | - | - |
| Secured loans | 0.00 | - | - | - | - | - | - |
| Unsecured loans | 248 | - | - | - | - | - | - |
| Total debt | 248 | - | - | - | - | - | - |
| Total liabilities | 14,662 | - | - | - | - | - | - |
| Assets | |||||||
| Gross block | 1,882 | - | - | - | - | - | - |
| Net block | 882 | - | - | - | - | - | - |
| Capital work in progress | 239 | - | - | - | - | - | - |
| Investments | 2,220 | - | - | - | - | - | - |
| Inventories | 2,209 | - | - | - | - | - | - |
| Sundry debtors | 3,435 | - | - | - | - | - | - |
| Cash & bank balances | 4,826 | - | - | - | - | - | - |
| Loans & advances | 4,355 | - | - | - | - | - | - |
| Total current assets | 14,824 | - | - | - | - | - | - |
| Total current liabilities | 5,128 | - | - | - | - | - | - |
| Net working capital | 9,696 | - | - | - | - | - | - |
| Total assets | 14,662 | - | - | - | - | - | - |
| Particulars | FY 2025-26 | Sep 2024 | Sep 2023 | Sep 2022 | Sep 2021 | Sep 2020 | Sep 2019 |
|---|---|---|---|---|---|---|---|
| Opening cash | 1,495 | - | - | - | - | - | - |
| Net cash from operating activities | (971) | - | - | - | - | - | - |
| Net cash from investing activities | 4,052 | - | - | - | - | - | - |
| Net cash from financing activities | (3,274) | - | - | - | - | - | - |
| Net change in cash | (192) | - | - | - | - | - | - |
| Closing cash | 4,826 | - | - | - | - | - | - |
| Particulars | FY 2025-26 | Sep 2024 | Sep 2023 | Sep 2022 | Sep 2021 | Sep 2020 | Sep 2019 |
|---|---|---|---|---|---|---|---|
| Growth | |||||||
| Sales growth | - | -25.4% | +21.1% | +18.4% | +26.9% | -24.1% | - |
| EBITDA growth | - | -24.5% | +39.3% | +12.2% | +42.9% | -32.1% | - |
| PBT growth | -34.2% | +27.9% | +29.8% | +33.9% | +43.6% | -38.6% | +19.3% |
| Net income growth | - | +23.0% | +25.0% | +37.4% | +45.6% | -28.2% | - |
| Revenue CAGR (3Y) | +12.0% | +2.3% | +22.1% | +4.5% | -0.5% | -3.6% | +6.4% |
| EBITDA CAGR (3Y) | +8.9% | +5.7% | +30.7% | +2.9% | +2.8% | -1.8% | +14.1% |
| Profitability & leverage | |||||||
| Net income margin | +11.6% | +19.9% | +10.6% | +10.3% | +8.8% | +7.7% | +8.4% |
| Return on capital employed | +12.3% | +15.0% | +19.9% | +14.8% | +14.2% | +11.1% | +18.9% |
| Return on net worth | +12.0% | +16.5% | +15.5% | +13.8% | +11.1% | +8.2% | +12.5% |
| Debt / equity | 0.02 | 0.01 | 0.01 | 0.02 | 0.02 | 0.01 | 0.00 |
| Long-term debt / equity | 0.01 | 0.01 | 0.01 | 0.01 | 0.01 | 0.01 | 0.00 |
| Interest cover | 3.16 | 4.12 | 2.80 | 4.29 | 3.71 | 7.76 | 2.96 |
| Efficiency & per share | |||||||
| Fixed asset turnover | 6.73 | 5.72 | 8.26 | 6.93 | 6.00 | 4.92 | 6.62 |
| Inventory turnover | 6.41 | 5.79 | 8.59 | 8.45 | 9.31 | 8.97 | 11.64 |
| Debtors turnover | 3.95 | 3.59 | 5.12 | 4.25 | 3.82 | 2.85 | 3.49 |
| EPS (₹) | 47.68 | 74.86 | 53.69 | 43.00 | 30.98 | 21.25 | 30.53 |
| Dividend per share (₹) | 18.00 | 12.00 | 10.00 | 10.00 | 8.00 | 7.00 | 7.00 |
| Book value per share (₹) | 379.93 | 428.29 | 365.86 | 325.73 | 290.55 | 266.12 | 254.03 |
Siemens has strategically engaged in corporate development activities, having acquired 107 companies. Notable acquisitions include AEC - American Electronic Components, AIT and AXIT GMBH.
| Company Name | Description | Domain | Location | Founded | Acquired | Amount |
|---|---|---|---|---|---|---|
EDA software for SoC timing closure challenges is provided. | excellicon.com | Laguna Hills, United States | 2008 | May 2025 | •••• | |
Online portal for engineering and technology projects is operated. | wevolver.com | San Francisco, United States | 2004 | May 2025 | •••• | |
PCB design-to-manufacturing data preparation solutions are provided. | downstreamtech.com | 0 | Apr 2025 | •••• | ||
AI powered scientific data management and workflow automation solutions | dotmatics.com | 2005 | Apr 2025 | $5.1B | ||
AI-powered data science platform enables model deployment and analytics insights. | altair.com | Troy, United States | 1985 | Oct 2024 | $10.6B | |
Manufacturer of energy efficiency products | danfoss.com | Nordborg, Denmark | 1933 | Oct 2024 | •••• | |
SCADA-based switchgears for distribution automation are manufactured by Trayer. | trayer.com | San Francisco, United States | 1962 | Sep 2024 | •••• | |
Autonomous machine vision systems for quality inspection are provided. | inspekto.com | Tel Aviv, Israel | 2017 | Feb 2024 | •••• | |
Artificial intelligence is applied to water sector management by BuntPlanet. | buntplanet.com | San Sebastian, Spain | 2000 | Dec 2023 | •••• | |
Electronic design automation tools for integrated circuit testing are provided. | insighteda.com | Millbrae, United States | 2007 | Nov 2023 | •••• |
Acquired stakes, deal sources and the complete acquisition history require an active premium plan.
Verified entity values are shown only after access is granted.
14 dated milestones of Siemens across 178 years, from founding to its latest funding, stage changes and deals.
Siemens has 3 listed competitors in our database, 2 of them funded. They include Cogniac, Cumulus Digital Systems and Headwall Photonics.
| Company Name | Domain | Founded | HQ Location | Total funding | Employees | Description |
|---|---|---|---|---|---|---|
| cogniac.ai | 2015 | San Jose, United States | $45.79M | 37 | AI-based platform is utilized for managing visual operations in businesses. | |
| cumulusds.com | 2018 | Cambridge, United States | $12.5M | 22 | Cloud-based platform for construction operations and maintenance management is provided. | |
| headwallphotonics.com | 2003 | Fitchburg, United States | 71 | Remote-sensing and machine vision solutions for industrial inspections are provided. |
The full competitor set, operating metrics and side-by-side benchmarks require an active premium plan.
Verified entity values are shown only after access is granted.
The website of Siemens (siemens.com) receives about 7.9M visits a month and ranks #5,833 among all websites worldwide, #853 in Consumer Electronics.
▲ 9.1% vs previous month
per month
among all websites
Computers Electronics and Technology · Consumer Electronics
Websites whose visitors overlap most with Siemens. Affinity shows how closely the audiences match.
| Website | Domain | Audience affinity | Monthly visits | Global rank | Profile |
|---|---|---|---|---|---|
| nokia.com | 100% | 2.6M | #18,363 | View details | |
schneider-electric.com | schneider-electric.com | 90% | #41,263 | – | |
| phoenixcontact.com | 88% | #32,802 | View details | ||
| rockwellautomation.com | 88% | 1.8M | #28,972 | View details | |
siemens-home.de | siemens-home.de | 83% | – | ||
| •••••••••• | ••••••.com | ••% | •.•M | #••••• | – |
| •••••••••• | ••••••.com | ••% | •.•M | #••••• | – |
| •••••••••• | ••••••.com | ••% | •.•M | #••••• | – |
The complete similar-websites list, audience overlap and engagement analytics require an active premium plan.
Verified entity values are shown only after access is granted.
Unlock complete access to The Company Check
Get unrestricted viewing across everything we track — from companies and brands to investors, funding rounds, acquisitions, financials, and more.

Full article history, source details, and older brand coverage require an active premium plan.
Verified entity values are shown only after access is granted.
Siemens was founded in 1847 and raised its 1st funding round 157 years after it was founded.
Siemens is headquartered in United States.
Roland Busch is the CEO of Siemens, as recorded in our data.
Siemens has 11,710 employees.
The primary company behind Siemens, Siemens Limited, reported revenue of ₹26,069 Cr for FY 2026, up 9% year on year.
Siemens was founded in 1847 and is headquartered in the United States. Industrial software is developed by the company, focusing on automation, electrification, and digitalization within the technology sector. A marketplace for digital offerings and associated services is operated. Resources covering corporate details, privacy policies, and terms of use are maintained. Dedicated channels for press releases, investor relations, and career opportunities are provided to stakeholders.
Siemens's top competitors include Headwall Photonics, Cumulus Digital Systems and Cogniac.
Siemens offers Xcelerator Marketplace, Generative AI Solutions, and Products and Services.
Yes, Siemens is publicly traded on NSE under the ticker symbol SIEMENS.
Siemens has made 107 acquisitions, including AEC - American Electronic Components, AIT, and AXIT GMBH.
Siemens has 5 investors. Key investors include European Union, BMBF, Federalministryforeconomicaffairsandenergy, OSTI.GOV, and Military Health.
Siemens operates through Siemens Limited.