IPO & Listings Database
Track 70K+ IPOs and listed securities across BSE and NSE in India plus global exchanges — IPO date and issue size, price band and listing price, and live market data including market cap, P/E, EPS and dividend yield, alongside each company's financials. Sourced from BSE & NSE, SEBI and rating agencies, and refreshed daily.
From an IPO to its complete listing and market record
Search by company, ticker or exchange and open a complete, standardised listing profile — exchange (BSE and NSE in India plus global exchanges), IPO date and issue size, price band and listing price, and live market data including market cap, P/E, EPS and dividend yield — all mapped to the company's audited financials. Track public-market activity, screen listed peers side by side, and research IPO history across 70K+ IPOs and listings, with every field traceable to the exchange or an official source.
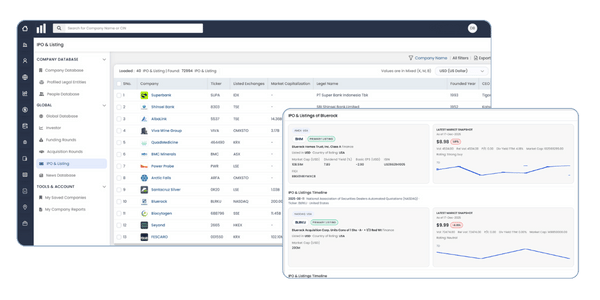
IPO date and issue size, price band and listing price, and the issuing exchange — BSE and NSE in India plus global exchanges — for every offering in the database.
Market cap, P/E, EPS and dividend yield kept current from the exchanges, so you can value a listed security and gauge its market standing at a glance.
Each listing maps to the company's audited financials and ratios, connecting market valuation to the underlying balance sheet, P&L and cash flow.
Screen listed peers side by side and research IPO history across sectors and exchanges to track public-market activity over time.
Related Pages
Navigate across connected data sources
What's Included
A practical set of fields built for screening, comparing, and understanding data.
Frequently Asked Questions
Quick answers commonly asked by users exploring this data.
What's included in an IPO and listing profile? +
The exchange — BSE and NSE in India plus global exchanges — IPO date and issue size, price band and listing price, and live market data including market cap, P/E, EPS and dividend yield, all mapped to the company's audited financials. Every field traces back to the exchange or an official source.
Where does the data come from, and how current is it? +
From the exchanges and official market sources — BSE and NSE, SEBI and rating agencies — consolidated into one profile and refreshed daily, with market data such as market cap, P/E, EPS and dividend yield kept current.
What exchanges and how many listings are covered? +
Coverage spans 70K+ IPOs and listed securities across BSE and NSE in India plus global exchanges, so you can track public-market activity in India and worldwide from one database.
Can I screen and compare listed companies? +
Yes. Live market data and linked financials are built for side-by-side peer screening, so you can compare listed companies on market cap, P/E, EPS and dividend yield and research IPO history across sectors and exchanges.