Detailed Financials Database
Screened financials for 1.3M+ Indian companies — full balance sheet, profit & loss and cash flow with 20+ ratios and up to 10 years of history and CAGR, format-specific schemas for companies, NBFCs and LLPs, auditors and CARO disclosures, related-party transactions, and a proprietary 0–100 Financial Health Score.
From scattered filings to a clean, comparable financial profile
Open any company and read its full balance sheet, profit & loss and cash-flow statements with 20+ ratios and up to 10 years of history and CAGR. Format-specific schemas keep companies, NBFCs and LLPs each on the right template, so line items stay accurate and comparable. Every profile pairs the numbers with auditors and CARO disclosures and related-party transactions, then distils them into the proprietary 8-dimension Financial Health Score (0–100). Built for side-by-side peer and four-way company comparison across 1.3M+ screened financials.
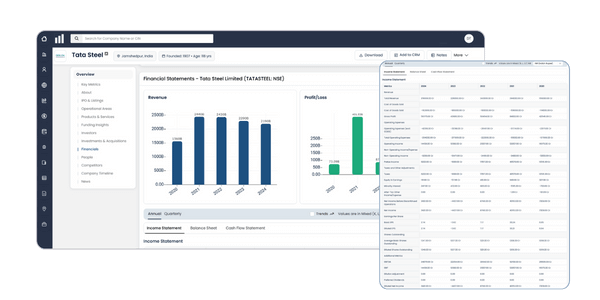
Full balance sheet, profit & loss and cash-flow statements with up to 10 years of history and CAGR, presented in a clean, standardised layout for easy reading and comparison.
Pre-calculated liquidity, leverage, profitability and efficiency ratios with year-over-year trends, so you can read financial strength without rebuilding the math.
Companies, NBFCs and LLPs each mapped to the right template, with auditors and CARO disclosures and related-party transactions kept alongside the numbers.
A proprietary 0–100 score that distils the full financial picture into a single, comparable read of strength and risk across eight dimensions.
Related Pages
Navigate across connected data sources
What's Included
A practical set of fields built for screening, comparing, and understanding data.
Frequently Asked Questions
Quick answers commonly asked by users exploring this data.
What's included in a detailed financial profile? +
Full balance sheet, profit & loss and cash-flow statements with 20+ ratios and up to 10 years of history and CAGR, format-specific schemas for companies, NBFCs and LLPs, auditors and CARO disclosures, related-party transactions, and the proprietary 8-dimension Financial Health Score.
How many years of history and what depth do you cover? +
Up to 10 years of standardised statements per company, with 20+ pre-calculated ratios and CAGR across liquidity, leverage, profitability and efficiency — built from official filings and refreshed daily across 1.3M+ screened financials.
Do you handle NBFCs and LLPs differently from companies? +
Yes. Format-specific schemas map companies, NBFCs and LLPs each to the right template, so line items stay accurate and statements remain comparable across entity types.
What is the Financial Health Score? +
A proprietary 0–100 score across eight dimensions that distils the full financial picture — statements, ratios and trends — into a single, comparable read of strength and risk, built for side-by-side peer and four-way company comparison.