Financials Insight
See the full financial picture of any company — balance sheet, profit & loss and cash flow with 20+ ratios and up to 10 years of history and CAGR, distilled into a proprietary 0–100 Financial Health Score across eight dimensions, with peer and four-way comparison. Built on 1.3M+ screened financials.
From three financial statements to one clear verdict
Open a company and read its financial position end to end — balance sheet, profit & loss and cash flow rendered in format-specific schemas for companies, NBFCs and LLPs, with 20+ ratios spanning growth, profitability, liquidity, leverage and efficiency, and up to 10 years of history with CAGR to show the trajectory. Every statement rolls up into the proprietary 0–100 Financial Health Score across eight dimensions, so a long set of figures becomes one defensible verdict. Compare a company against its peers or run a four-way comparison across 21 sectors and 647 segments — all built on 1.3M+ screened financials drawn from MCA filings, auditors and rating agencies, and refreshed daily.
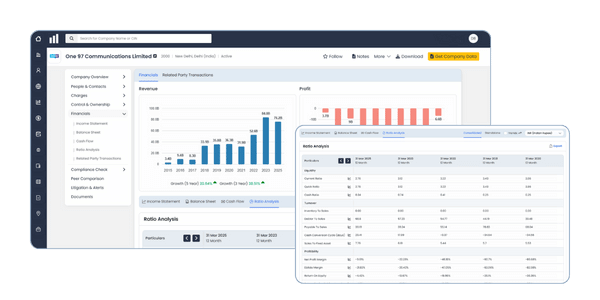
Balance sheet, profit & loss and cash flow in format-specific schemas for companies, NBFCs and LLPs — not a trimmed summary.
Growth, profitability, liquidity, leverage and efficiency ratios with up to 10 years of history and CAGR to show direction, not just a snapshot.
The proprietary score across eight dimensions distils every statement and ratio into one defensible 0–100 verdict on financial strength.
Benchmark a company against its peers or compare up to four companies side by side, mapped across 21 sectors and 647 segments.
Related Pages
Navigate across connected data sources
What's Included
A practical set of fields built for screening, comparing, and understanding data.
Frequently Asked Questions
Quick answers commonly asked by users exploring this data.
What does the Financials insight show? +
The full balance sheet, profit & loss and cash flow in format-specific schemas for companies, NBFCs and LLPs, with 20+ ratios spanning growth, profitability, liquidity, leverage and efficiency, up to 10 years of history with CAGR, and the proprietary 0–100 Financial Health Score across eight dimensions.
How is the Financial Health Score calculated? +
It is a proprietary 0–100 score built across eight dimensions of financial strength, distilling the three statements and 20+ ratios into a single, comparable verdict on a company's performance and resilience.
Can I compare a company against its peers? +
Yes. The insight supports peer comparison and four-way comparison across up to four companies, with every entity mapped across 21 sectors and 647 industry segments for like-for-like benchmarking.
Where does the data come from, and how current is it? +
Financials are built on 1.3M+ screened statements drawn from MCA filings, auditors and rating agencies, standardised across 3.7M+ Indian entities and refreshed daily.